BEACH PROFILES 2000-2018
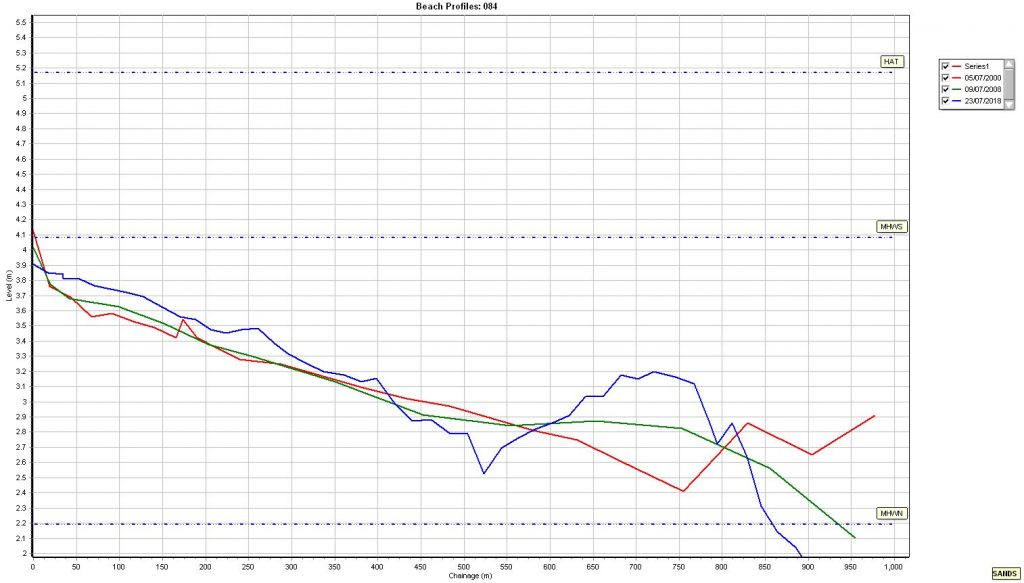
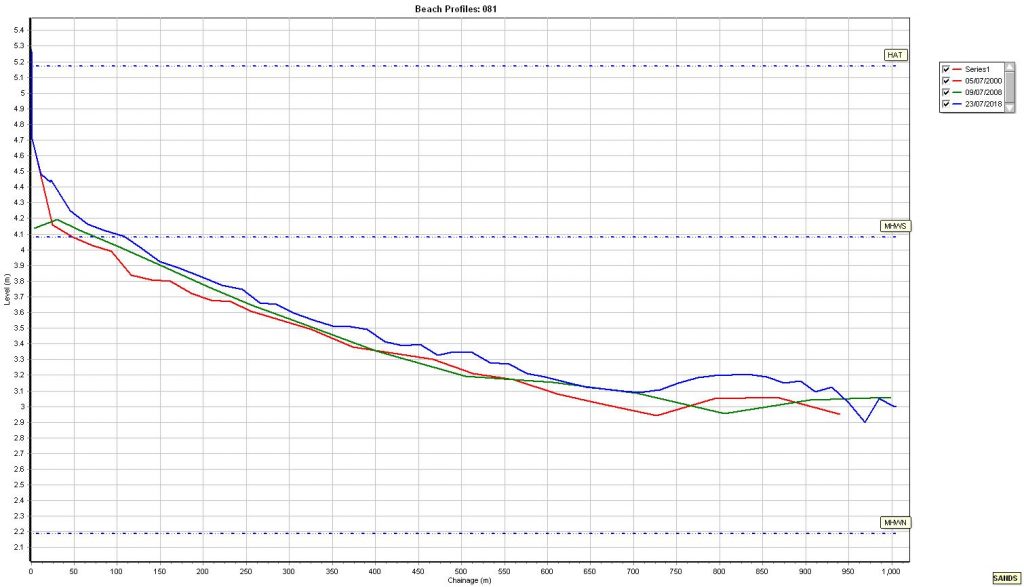
Road name locations are given for approximate reference. Chainage (distance from the promenade wall) is 1000 metres.
X-axis levels relate to Ordnance Datum, (OD, at Newlyn) which is 4.93 metres below Hilbre chart datum, so the (almost) 4.1 metre MHWS (mean high water spring tide; where there is the greatest difference between high and low tide) level on the x axis represents an actual near 9 metre MHWS tide locally. MHWN is neap tide (the smallest change between low and high tide). Note how far the MHSW tide is retreating.
At profiles 78-79 – Trinity Road to the old lifeboat station – the MHWS is retreating by up to 75 metres per decade as a result of upper beach accretion.
However, beyond 500 metres chainage from Kings Gap to the new lifeboat station and beyond 850 metres chainage out from Red Rocks, the levels are lowering, whereas accretion is particularly dramatic between 500 metres and 800 metres chainage between Red Rocks and Coronation Road.
Isn't it about time we make a real effort to gain a better understanding of how this is impacting on sediment type, sediment distribution, beach levels, types of vegetation and the impact of accretion on wave energy on the upper beach?
Understanding tides, with live high and low water times and heights at Hilbre Island:
Look at this live tide chart for Hilbre.
A tides with the shortest vertical distance between the red '+' marks is known as a neap tide (generally between about 3 metres at low tide and 7 metres at high tide). The mean (average) high neap tide is expressed as MHWN on the profile charts above.
A tide with the greatest vertical distance between the red '+' marks is a spring tide (generally between about 2 metres at low tide and 9 metres at high tide). The mean (average) high spring tide is expressed as MHWS on the profile charts above.
Mean high water is expressed as MHW and is half way between MHWN and MHWS.
The time of year, and of the lunar cycle, and therefore the relative positions of the sun and moon impact on the gravitational pull on the ocean which in turn affects tides. HAT (high astronomical tide) is about 10 metres at Hoylake, and is the highest tide possible before the additional factors of atmospheric pressure, ocean currents, wind speed and direction are also taken into account.
Hence, in certain circumstances, such as on a high astronomical tide, during a low pressure storm event when the moon is at perigee (closest to earth in its monthly orbit), then very high tides of up to about 12 metres can occur, with a risk of flood damage.


